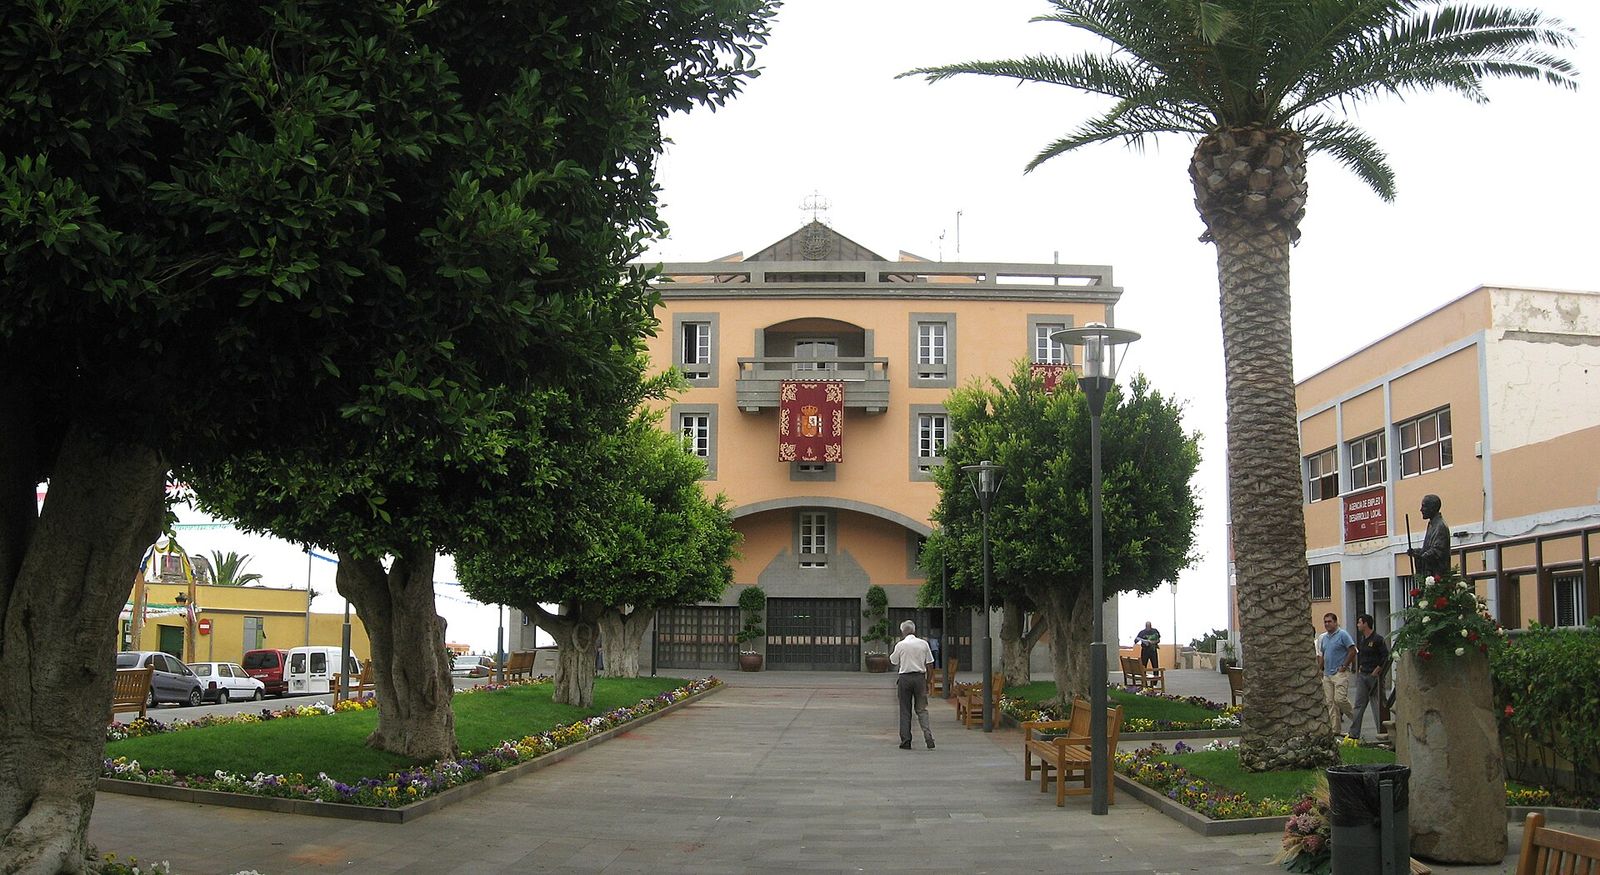
.jpg)
Granadilla de Abona
Santa Cruz de Tenerife · the Canary Islands
Granadilla de Abona is a municipality of 59,126 residents in Santa Cruz de Tenerife province, the Canary Islands, about 6 km from the nearest coastline. Registered long-let rents average €8.47/m² a month — roughly 52% above the national municipal average of €5.57. Among residents, about 5% hold Italian nationality.
“Granadilla de Abona is a town of 5,600 inhabitants (2014) in southern Tenerife, the largest of the Canary Islands.”
The case for Granadilla de Abona
- 7.9 hours of sunshine a day, averaged across the year
- only 14 rainy days a year
- 19.7°C average winters
- TFS airport 20 minutes away
- San Cristóbal de La Laguna — a 100,000+ city — 59 minutes by road
- 164 restaurants and cafés
- 23 schools in town
- 13.4% of residents are under 15 — more children than the typical Spanish town
- 97% fibre-to-the-home coverage
No adjectives, no opinions — every line is a measured value from the data below, shown only when Granadilla de Abona genuinely earns it. Distances marked "as the crow flies" are straight-line estimates.
Granadilla de Abona's Spainability Scores
Percentile within each canonical persona's scoreable municipality pool.
Higher than 50% of 2,555 scoreable municipalities.
Higher than 86% of 8,088 scoreable municipalities.
Higher than 74% of 8,088 scoreable municipalities.
Not scored — excluded by this tight-budget profile's affordability gate: the registered rent here (€8.47/m²·mo) is in the priciest 10% nationally.
Not scored — excluded by this tight-budget profile's affordability gate: the registered rent here (€8.47/m²·mo) is in the priciest 10% nationally.
Not scored — excluded by this tight-budget profile's affordability gate: the registered rent here (€8.47/m²·mo) is in the priciest 10% nationally.
Published data for Granadilla de Abona
Climate
- Winter average temp
- 19.7°C top 1% of 8,131 towns 11.9°C above the Spanish average (7.8°C)
- Summer high (Jul–Aug)
- 28.3°C top 24% of 8,131 towns 1.9°C below the Spanish average (30.2°C)
- Rainy days a year
- 14 days top 1% of 8,088 towns 80% less than the Spanish average (69 days)
- Sunshine estimated
- 7.9 h/day top 20% of 3,829 towns 9% more than the Spanish average (7.2 h/day)
- Summer water stress (WEI+)
- no local data
- River-flood depth (T=100, town centre) estimated
- 0 m top 1% of 8,129 towns 0.04 m below the Spanish average (0.04 m)
- River-flood risk score estimated
- 0 top 1% of 8,129 towns about the Spanish average (0)
- Wildfire burn rate (2010–23)
- 2.48 ha/km² bottom 10% of 8,132 towns 0.17 ha/km² above the Spanish average (2.31 ha/km²)
- Forest fires (2010–23)
- 2 bottom 42% of 8,132 towns 4 below the Spanish average (6)
- High fire-weather days (province) regional estimate
- 30.9% bottom 1% of 8,130 towns 8% above the Spanish average (22.9%)
Cost & economy
- Home price
- €2,475/m² appraisal (valor tasado) bottom 36% of 306 towns 12% more than the Spanish average (€2,208/m²)
- Asking price
- no local data
- Registered long-let rent
- €8.47/m²·mo
- Registered rent p25
- €6.67/m²·mo
- Registered rent p75
- €10.7/m²·mo
- Registered-rent yield
- 4.11% bottom 45% of 306 towns
- Net income per person
- €11,489 bottom 13% of 8,059 towns 21% less than the Spanish average (€14,495)
- Income growth ’18–’23
- 29.2% top 31% of 6,605 towns
Schools
- Schools in town
- 23 top 2% of 7,042 towns
- Nearest international school
- 12 km top 11% of 8,132 towns
- PISA maths (region) regional estimate
- 447 #17 of 17 regions, −32 vs national 34 below the Spanish average (481)
Healthcare
- Drive to a hospital
- 20 min top 22% of 8,132 towns
- Nearest health centre
- 54.6 km bottom 4% of 8,132 towns
- Surgical wait (region) regional estimate
- 106 days #12 of 17 regions, +3 days vs national about the Spanish average (108 days)
Getting around
- Drive to nearest airport
- 20 min top 2% of 8,132 towns
- Fibre-to-home coverage
- 97% top 19% of 8,132 towns 18% above the Spanish average (79%)
- 100 Mbps+ coverage
- 98% top 29% of 8,132 towns 14% above the Spanish average (83%)
Who lives here
- Population
- 59,126
- Born in Spain
- 55.9% 32.9% below the Spanish average (88.8%)
- Born elsewhere in EU/UK
- 11% 7.1% above the Spanish average (3.8%)
- U.S.-born residents
- 1.07 per 1,000
Monthly climate normals
Numbers: Spainability town dataset. Missing fields are shown as missing. Registered rent, sale appraisal and asking-price figures keep their separate basis labels.
Questions to verify locally
- Ask whether current long-let rents match the registered-contract figure.
- Request recent comparable sales before relying on the appraisal figure.
- Test fibre speed at the exact address, not the town average.
- Visit local schools and confirm places for incoming families.
- Confirm health-centre registration and opening hours in person.
- Ask an insurer how the mapped flood or wildfire exposure affects cover.
Nearby towns
Other places we cover within easy reach.